The scopes module, at the top of the darkroom left panel, provides graphical depictions of the image’s tones and chromaticity. It also hosts the global color picker.
Drag the bottom edge of the module to resize the scope vertically.
Note
For performance, the scopes are computed from the lower-resolution preview pipeline (the same image shown in the navigation module), not from the full-resolution center image. Fine detail may therefore not be represented exactly.Choosing what to show
Use the hamburger menu in the module header to access the following sub-menu items:
- Show data from
- Where in the pixelpipe the data is sampled, which determines the color space of the plot:
- Raw image — straight off the sensor, before color processing.
- Output color profile — at the output color profile stage.
- Final display — after the full pipeline, in display space (what you actually see).
- Display
- The type of scope to draw:
- Histogram,
- Waveform (horizontal),
- Waveform (vertical),
- Parade (horizontal),
- Parade (vertical),
- Vectorscope.
Scope types
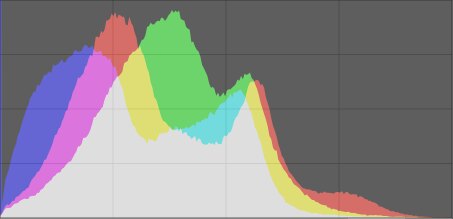
Histogram
The histogram shows the distribution of pixels by lightness for each RGB channel. The x-axis runs from 0 % to 100 % lightness; the y-axis is the pixel count at each lightness. Values piling up against the left or right edge indicate shadow or highlight clipping.
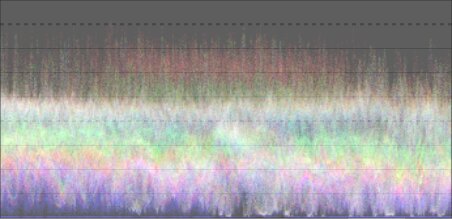
Waveform
The waveform shows the same tonal distribution as the histogram, but in a spatial context.
In the horizontal waveform, the x-axis matches the x-axis of the image: the left of the plot corresponds to the left of the image. The y-axis is lightness — the top is 100 % (values above may clip), the middle 50 %, the bottom 0 %. The brightness of each point is the number of pixels at that image position and lightness.
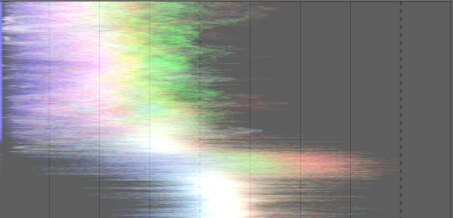
The vertical waveform maps the image’s y-axis instead, which can be more readable for portrait-format images.
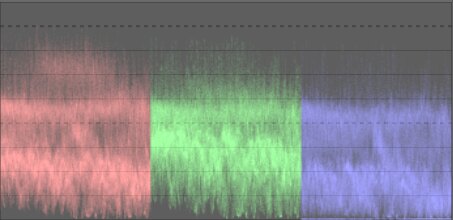
Parade
The parade shows the same data as the waveform, but with the red, green and blue channels drawn side by side (again in a horizontal or vertical variant). This is useful for matching the intensities of the three channels and for judging color casts.
Vectorscope
The vectorscope shows chromaticity independently of lightness and of spatial position. Distance from the center is chroma; angle is hue. Regions are tinted with the color they represent, and more frequently used colors appear brighter, so the plot conveys color “volume”. A hue ring marks the maximum chroma of each hue for the current profile, with the RGB primaries and secondaries marked by circles.
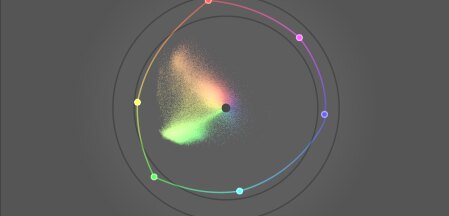
The vectorscope is computed in the CIELUV color space.
Caveats
- The hue ring is not a gamut check: a color can sit inside the ring yet still be out of gamut because of its lightness.
- There is deliberately no “skin tone line”, which is a flawed generalization rather than a standard.
- The vectorscope is a colorimetric encoding, which inevitably diverges from a viewer’s perception.
- To neutralize a color cast from a reference chart, the color-checker workflow in color calibration is faster and more accurate.